Introducing Difference View - A More Efficient Way to Compare Chromatograms
What's New in 2025
Version 2025 introduces Difference View - a powerful new tool for pinpointing and understanding differences between two chromatograms. This new feature ensures that analysts can identify variations and review differences between two samples quickly.
Key Enhancements in Difference View
By computing a pixel-by-pixel directional comparison, Difference View highlights what is present in the first chromatogram but absent or diminished in the second. It goes beyond standard subtraction methods, integrating advanced alignment and transformation capabilities to deliver highly accurate results, including:
-
Precise Alignment: Leverages alignment markers and transformations to ensure a reliable side-by-side comparison.
-
Fuzzy Radius: Optimizes pixel matching, countering local variations for enhanced accuracy.
-
Normalization Options: Adjust how the second chromatogram is normalized relative to the first for improved comparison clarity.
-
Advanced Filtering: Select from % Recovery or Fold Change to refine difference results while accounting for baseline fluctuations.
-
Dedicated Review Table: Displays differentiating compounds, both matched and unmatched, allowing users to review and integrate findings seamlessly into further analysis.
Example - Benchmark GCxGC Data, Chocolate
Pre-processing and Examining Alignment
-
Follow the Quick Start Demo steps to process the Benchmark GCxGC Data, Chocolate dataset.
-
Open the
Cafe_Bimage. -
Tools > Compare Images - Side-by-Side > choose the
MangoPassionFruit_Bimage to compare. -
Switch to Alignment Markers table, double check the markers, and add and apply additional markers if necessary.
How to Add Alignment Markers
- Automatic pairing: Pairs of blobs with identical compound names across the two images are added automatically.
- Manual addition: Marker blobs can also be added manually as shown below.
See here for more details.
Setting Up the Difference View
-
Switch to Differences view,
- Set Filter to % Recovery ≥
90% - Set Col II Fuzzy Radius to
2 - Uncheck Recompute Value Map
- Set Filter to % Recovery ≥
Reviewing Unique Compounds in Analyzed vs. Reference
-
Zoom-in > click on a peak shown in [A]-[R]* > confirm the uniqueness in [A] and add to the Review table
-
Click on the other peak shown in [A]-[R]*.
- Note that the two spectra share the same base peak
110although the peak in [R] is barely visible. So, this compound may not be unique.
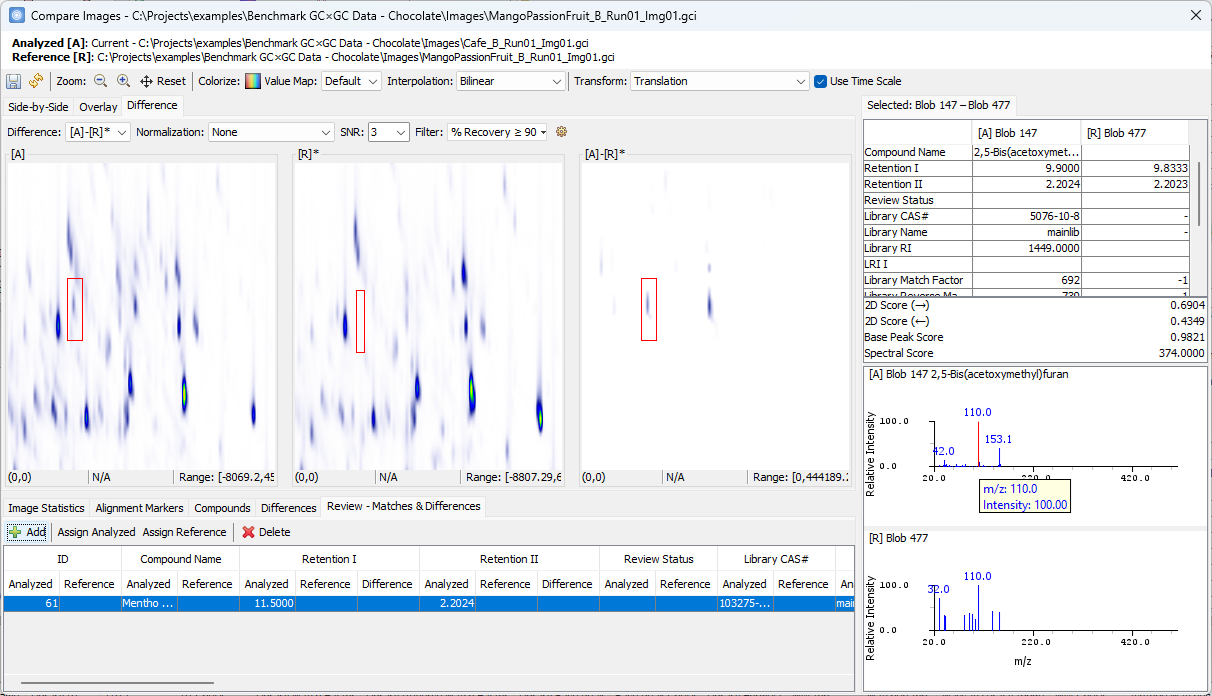
- Note that the two spectra share the same base peak
Reviewing Unique Compounds in Reference vs. Analyzed
-
Switch to show the difference of [R]-[A]*, and review the unique difference in [R]
Exporting Differences to a Template
-
Right click on the Review table > Save as a CSV file
-
Go to the main window > switch to the Template mode > go to the main menu: Template > Import Compound List to import the CSV table to a peak template (See here for more details).