GC IMAGE - GC Image GCxGC Edition - User Guide 2026R1
New Features and Improvements in Version 2024
GC Image GCxGC Edition 2024 has many new features and improvements. See
the GC Image GCxGC Edition User Guide for full
documentation.
What's New in Version 2024 Release 3 (December 2024)
Version 2024R3 now supports the 64-bit Thermo Scientific
MSFileReader (including the latest version 3.1SP4) for importing
Thermo .raw files. This upgrade enables the importing of larger .raw data
files and improves overall import reliability.
The rolling ball baseline detection
algorithm now has substantially faster performance, particularly when
using small ball radius values.
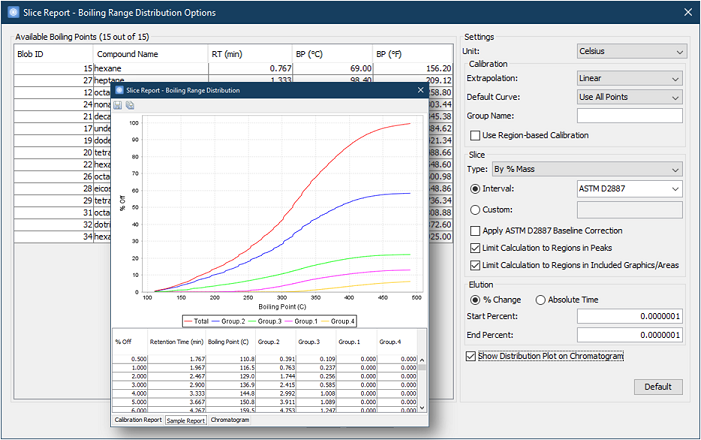
Version 2024R3 adds a new option to the Slice Report for overlaying a
distribution plot directly onto the chromatogram image. This provides
a more comprehensive visual representation of the distribution data
within the analyzed sample.
Version 2024R3 significantly improves CLIC
capabilities and performance, including:
- Increased CLIC Column Support: The Blob
Table now supports up to 20 CLIC columns, doubling
the previous limit of 10.
- Improved CLIC Performance: Faster CLIC column recomputation
leads to faster operations for editing blobs, undoing actions, and
initiating review.
- New CLIC Functions:
- ISNAN( arg1 ): Checks if the argument
is not a number.
- STRCONCAT( string1, string2, ... ):
Concatenates the specified strings.
- Enhanced Isotopic Functions:
- The ISOTOPEMATCHES, ISOTOPESIMILARITY, and MATCHEDMASS
CLIC functions now support using configured mass binning settings.
- The ISOTOPEMATCHES and ISOTOPESIMILARITY CLIC
functions are now significantly faster.
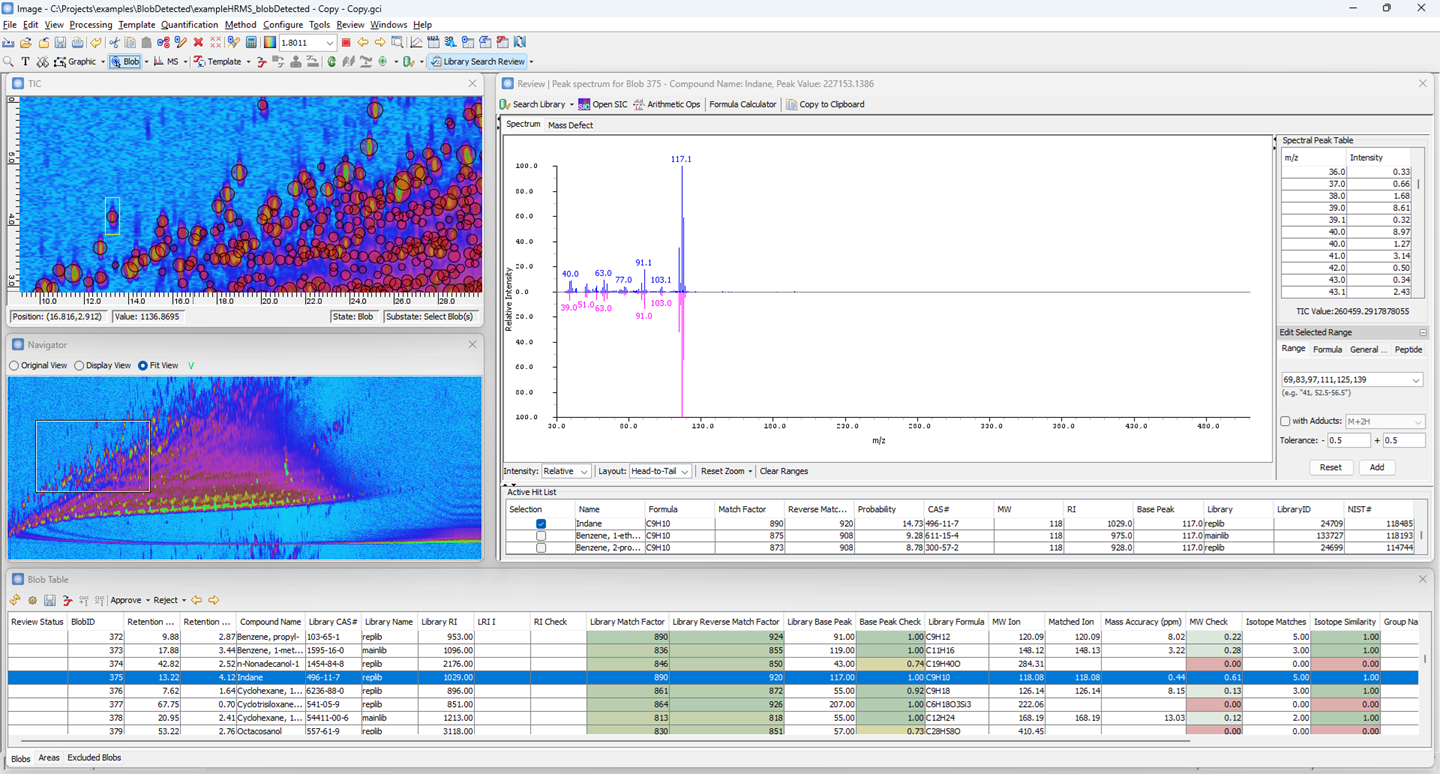
Version 2024R3 introduces a dedicated Library Search Review
mode designed for efficient evaluation of library search hit list
assignments and more confident compound identification for all blobs. This mode incorporates:
- Hit Evaluation Constraints: Leverage predefined Blob Table
columns to assess hit quality based on factors like retention
index, base peak, molecular weight ions, and isotopic similarity.
- Color-Coded Scoring: Visually identify compounds with
uncertain (yellow) or likely incorrect (red) identifications through
color-coded values.
- Alternative Hit Selection: Easily explore and select
alternative identifications in hit lists from the interface.
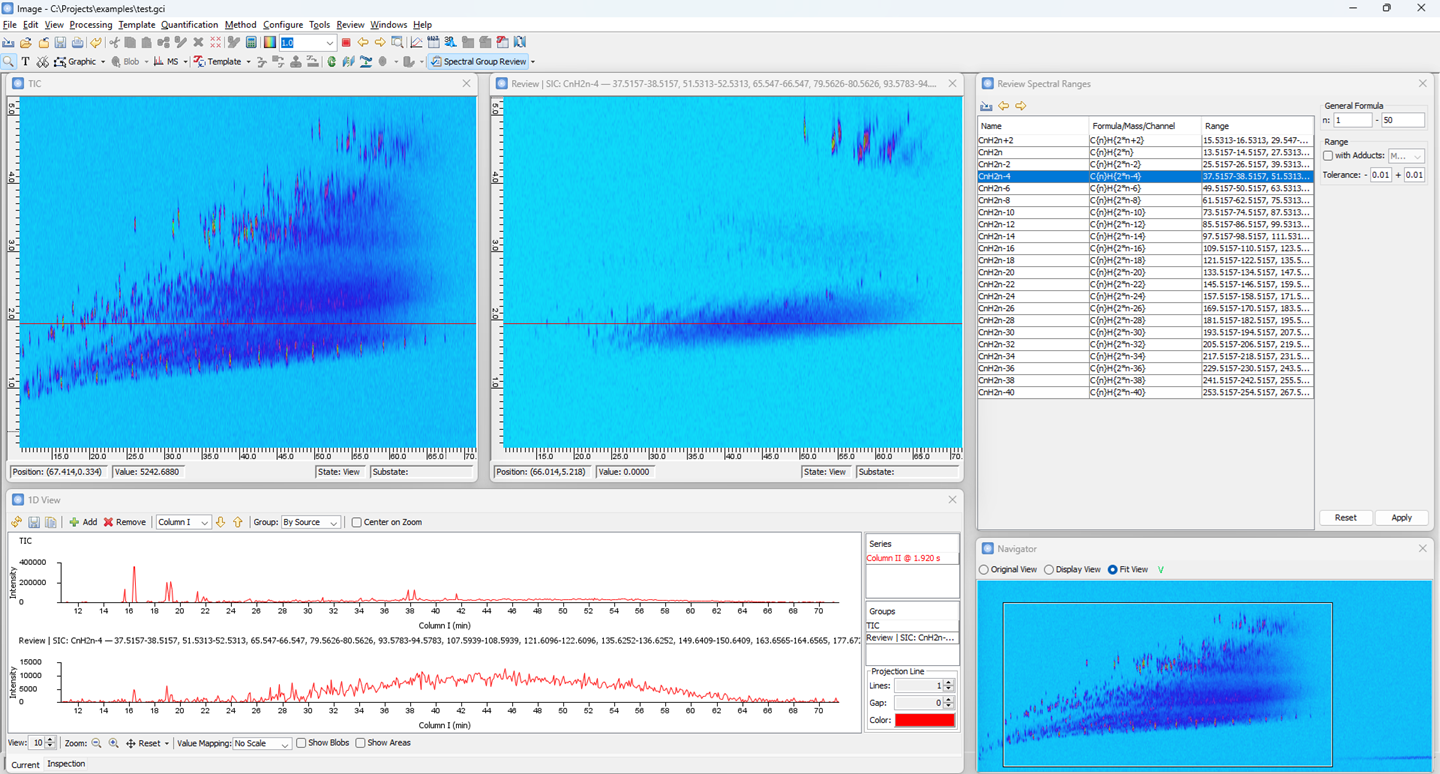
Version 2024R3 introduces a new Spectral
Group Review mode that facilitates rapid exploration and
visualization of targeted ion chromatograms (SICs) defined by a
variety of input sources.
- Flexible Range Selection: Analyze data based on the full
spectral range, common hydrocarbon groups, or custom spectral ranges
imported from CSV or XML files.
- Interactive Range Exploration: The Review Spectral
Ranges table enables interactive selecting and viewing of SICs and
supports options for adjusting spectral ranges based on tolerance,
adducts, etc..
Version 2024R3 introduces several improvements to Review Mode, including:
- New 1D View Settings: Control visibility of blobs or areas in
1D View with Always Show Blobs and Always Show Areas
options.
- Improved Initialization:
- Review now automatically selects the first blob if no
selection exists.
- Review now automatically displays the selected spectrum
from the hit list.
- The 1D View now displays a more descriptive title for the SIC
data series.
- Duplicating an existing configuration now creates a
configuration with a unique display name.
- The features table of a review configuration is now more readable with a wider
feature column and improved resizing behavior.
Version 2024R3 now includes an Enhanced
with Library Search option for the Auto Feature workflow, which
provides a convenient way to enable library searching on feature
areas in order to assign potential identification for each feature in the
feature template.
What's New in Version 2024 Release 2 (September 2024)
Version 2024R2 includes significant improvements to the 1D View:
- Blob Selection: When the Show Blobs option is enabled, blobs can now be selected directly from the 1D View graphs.
Hovering the mouse over a blob will highlight the blob, and show the blob ID in the tooltip.
- Layout and Navigation: The graph layout now ensures a minimum graph height while expanding to fit the
specified view count. A scroll bar has been added to replace the page buttons, allowing for smoother
navigation through multiple graphs.
- Series and Groups: The 1D View series list has been improved for better organization. A new Groups table
provides a clear overview of graph groups, allowing users to select rows to highlight and scroll the
corresponding graph into view. Additionally, selecting a row from the Series table will now highlight the
series in bold within the graphs.
- Unit Labels: Location-based series and group names now include units, providing more context. In addition,
the graphs' x-axis labels display units.
- Visual Enhancements: The 1D View graphs have been visually improved with the use of anti-aliasing and
better y-axis label positioning. These enhancements also benefit the MS Viewer.
 |
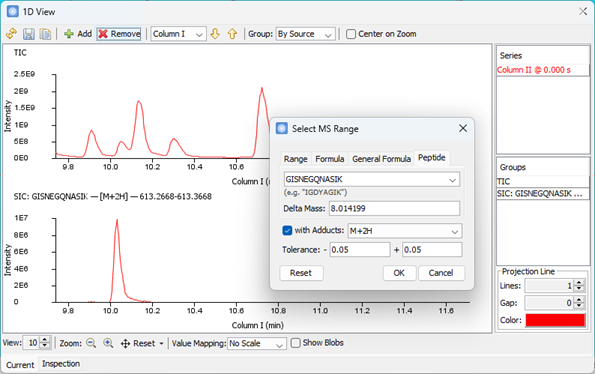
Version 2024R2 introduces enhanced capabilities for MS range
selection, allowing users to specify peptide sequences for selected ion
chromatogram (SIC) extraction.
- Peptide Sequence Input: View SIC now accepts
peptide sequences represented by
one-letter symbols for amino acids.
The MS Viewer also accepts peptide sequences.
- Delta Mass Consideration: A Delta Mass field is available for
specifying the mass change from peptide modifications.
- Adduct Selection: The MS range editor now remembers recently used Adduct selections,
making it easier and more efficient to choose adducts for the following analysis.
- MS Range Table Enhancements: The MS range tables of the MS Cube
and Multiple SIC View tables have been updated to show
Expression and Tolerance columns.
Version 2024R2 includes several enhancements to the Review Mode for evaluating ion peak areas:
- Ion Peak Width Metadata: Ion
Peak detection now reports additional peak width properties
including front-half, back-half, and FWHM. These new properties
provide more insights into ion peak shapes.
- 1D View Enhancements in Review Mode:
- Area Display: Visualize ion peak areas and review detection
in the 1D View with the new Show Area display toggle.
- Area Selection: Select drawn areas directly in the 1D View
for easier interaction.
- Selection Ions: Choose the number of Qualifier and
Quantifier ions to display individually in the 1D View to examine
prominent and apexing ions with the new Review Configuration options.
- Apex Normalization: Compare individual ions apexing
together more effectively with the new Apex Normalization
option, which normalizes all plots to the selected blob or area's
apex location.
- Tile Selected Windows Enhancements:
- Freeform: Fit windows to a custom grid based on their
current positions with the new Freeform option.
- Revert: Quickly restore the previous layout with the Revert
button.
 |
Version 2024R2 introduces several enhancements to multi-sample analysis:
- A peak template can be specified to provide reliable peaks
for the Auto Generate
Feature Template process. This allows for direct control over which
chromatogram peaks are used in the alignment process, such as a set
of internal standard peaks. This new option significantly reduces the
processing time compared to the automated creation of reliable peaks.
- The performance of spectrum parsing and spectral matching
calculations is substantially improved. This translates to quicker
execution of the Compound Finder, with the processing time
decreased by as much as 20%.
What's New in Version 2024 Release 1 (March 2024)
Version 2024R1 introduces significant improvements to the
reliability and performance of importing Shimadzu GCD, QGD, and LCD
files. The readers for Shimadzu files have been optimized to eliminate
random failures and significantly improve speed and efficiency.
Version 2024R1 includes a suite of new features designed to streamline
and enhance the quantification workflow using
group-based response factors.
- Improved Calibration and Response Factor Options:
- New Calibration Table from Response Factor Table: Easily
generate a calibration table from existing response factors with
the new New Calibration Table from Response Factor Table
menu under Quantification.
- Support Fit Intercept to 0: Gain greater control over
calibration ranges by forcing a calibration curve to pass through
the origin (0,0) with the new Set Intercept to 0 option.
- Flexible calibrant assignment for Unknowns: Choose None,
Default, Group Neighbor, or Nearest Neighbor
for uncalibrated compounds.
- Default Response Factor for Unknowns: Apply a pre-defined Default
Response Factor to uncalibrated compounds.
- Target Group Assignment for Calibrants: Enhance the
accuracy of your group-based calibration by assigning specific
target groups to individual calibrants using the new Target
Group option.
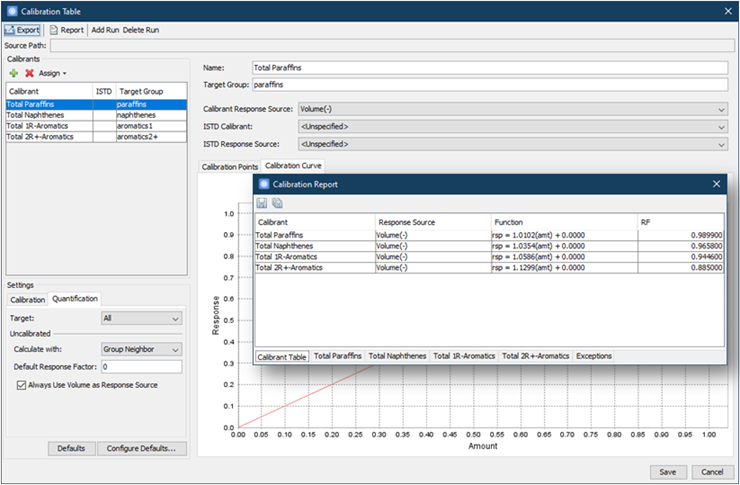
- Improved Reporting and Visualization:
- Interactive Calibration Report: Review the calibration
quality with an interactive report directly accessible from the
Calibration Table.
- Response Factor Column in Calibration Report: View response
factors alongside other crucial calibration parameters, if
appropriate.
- ISTD Column Visibility: ISTD columns are now only displayed
for ISTD calibrations, simplifying reports.
- Increased Decimal Places for Amount and Response: Improved
visualization of small values in the Calibration Table with 4
decimal places displayed for amount and response values.
 |
Version 2024R1 introduces significant improvements to the Slice
Report functionality, specifically designed to enhance the analysis
of boiling range distributions.
- Quick SimDist Report Generation: Generate SimDist reports
directly from an open image using the new Slice Report for
Boiling Range Distribution menu under Tools.
- Enhanced Control and Flexibility:
- Focused Calculation - Limit calculations to specific areas
of interest by utilizing the new option to restrict analysis to
regions within detected peaks or included graphics and areas.
- Tailored Baseline Correction - Gain finer control over the
analysis with the new option to enable/disable ASTM D2887 baseline
correction within Slice Reports. Disabling the option allows the
user to use the data, already processed with background
subtraction and normal baseline correction, without
further modification.
- Customizable Remainder Display - Choose to only show the
Remainder value when necessary (default behavior) or enable the new
Always Show Remainder option for backward compatibility.
- New ASTM D2887 Slice Option - Choose the predefined mass
percent-off intervals for ASTM D2887 analysis directly within the
Slice Report.
- Project-Level Enhancements:
- Expanded File Selection - Utilize all images within a
project for generating Slice, Slice Calibration, and ASTM D2887
reports.
- Streamlined Calibration Run Selection - Select calibration
runs within a project for Slice and ASTM D2887 reports with a more
friendly and consistent UI.
 |
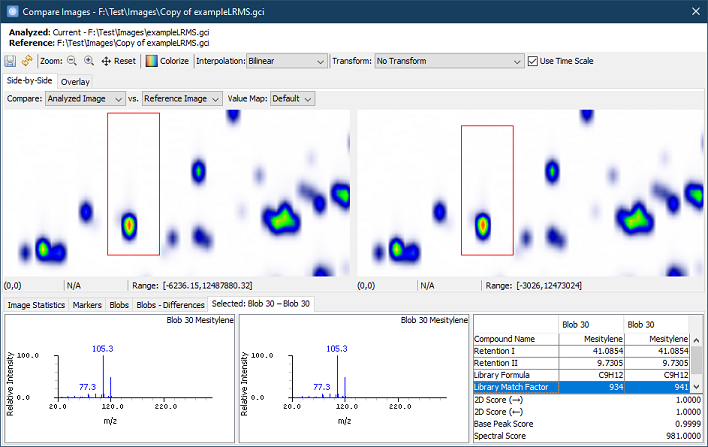
Version 2024R1 has new and improved functionality for Compare
Images Side-by-Side, making user analysis workflow more efficient and
intuitive:
- Enhanced Navigation: Auto-pan functionality upon selecting a
blob in the Compare Images tables eliminates the need for manual
scrolling, allowing the user to focus on specific regions of interest
in both chromatograms easily.
- Customizable Blob Attributes: Customizing blob attributes
based on current blob table configuration allows the user to tailor
the displayed information to the user's specific needs and highlight
the information most relevant to the investigation.
- Multitasking: The enhanced Compare Images tool now allows
the user to open multiple instances, each operating independently.
This enables the user to interact with other tools freely, while
comparing the open image with multiple images side-by-side and
performing additional analyses concurrently.
Version 2024R1 has several improvements to the Auto
Feature workflow, designed to streamline the process and enhance
efficiency:
- Automatic ISTD Selection: The Auto Feature process now
automatically identifies and sets the internal standard (ISTD)
present in all samples within the feature template. This ensures that
the subsequent analyses are based on reliable and consistent
reference peaks derived from the same ISTD compound across all
samples.
- Improved Error Handling and Logging: During the Auto Feature
validation step, any invalid run paths will now be logged for easier
troubleshooting. This helps identify potential issues with data
inconsistencies and facilitates addressing them promptly.
- Persistent Configuration for Streamlined Analysis: The Use
Configuration option will now persist across sessions. This
eliminates the need to manually re-select the option each time for a
multi-sample alignment task.
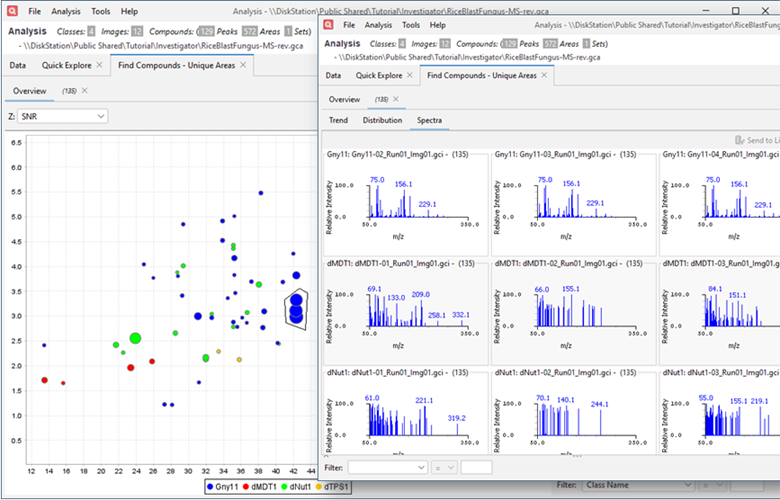
Version 2024R1 includes two new improvements that will enhance the
workflow for analyzing and comparing compounds across
multiple sample classes:
- New Compound Finder Algorithm: The enhanced Compound Finder 2024r1
algorithm improves the identification of both common and unique
compounds. It analyzes representative spectra of defined classes,
focusing on those consistently present within the majority of samples
belonging to the same class. These representative spectra are then
compared with spectra from other classes. This refined approach leads
to more accurate identification of common compounds across multiple
samples and unique compounds specific to individual samples.
- Enhanced Spectra View: The Spectra View now
provides a clearer and more informative presentation of class data,
including:
- Class names in title - Quickly identify the associated class
for each spectrum.
- Class groups - Easily visualize spectra grouped by their
assigned class.
- Alternating color scheme - Improved visual distinction
between different classes in the spectra plot.
 |
Version 2024R1 introduces several enhancements to the window
management system, making it easier to organize the workspace,
including:
- Enhanced Window Layout: The Tile Selected Windows
menu now manages all open windows, allowing the user to easily
arrange them in various tile layouts.
- Enhanced Window Switching: Access any open window directly
from the Windows menu, eliminating the need to look for them
on the screen.
- New Close All SIC Windows Menu: Close all SIC windows
with a single click.
- Auto Window Repositioning: Off-screen windows will
automatically come back into view when selected. Also, the main Image
window will be placed into view if it is off-screen. This improvement
makes it easier to switch between single and dual monitor setups.
- Clearer Layout Icons: New icons for Tile Vertically
and Tile Horizontally menus provide a more intuitive
understanding of the available layout options.
Version 2024R1 has other improved operations, including:
- Simplified MS Range Editing:
- Up to 10 recently used MS ranges and formulas for opening SIC views and selecting ranges will be
remembered. This helps save time and effort when revisiting
frequently used analyses.
- A list of common hydrocarbon general formulas is now
conveniently listed within the MS Range edit UI. This eliminates
the need for manual entry and reduces the risk of errors.
- The MS Range edit UI pane is now more compact and
collapsible in MS View.
- Enhanced Blob Set Table: For analyses involving sets of sets
(e.g., constellations, graphic groups, residuals), Blob
Set Table has a new ordering and color scheme. This improved
visualization makes it easier to identify and differentiate between
different levels of group hierarchy.
Contents
Next: Introduction
GC Image™ GCxGC Edition User Guide ©
2001–2024 by GC Image, LLC, and the University of Nebraska.